For most of the past decade, the story of India’s used car market was essentially a story about its largest cities. Delhi, Mumbai, Bengaluru, and Hyderabad drove volumes. National trends were, in many ways, just metropolitan trends dressed up in aggregate numbers.
That is no longer true. According to the Cars24 Gears of Growth Report 2025, Tier-2 cities now account for 62% of all used car sales in India, with metro cities contributing the remaining 38%. The centre of gravity has shifted, and it has brought with it a fundamentally different kind of buyer with different priorities, different budgets, and different ideas about what a car should do.
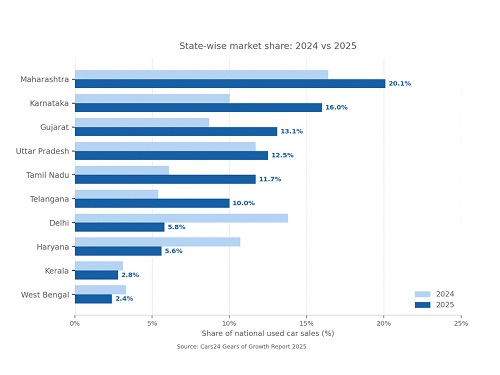
Delhi loses ground, Karnataka and Gujarat post some of the largest gains on record
The numbers from the Cars24 Gears of Growth Report tell a clear story about where momentum now lives in the Indian used car market. Delhi’s share of national sales dropped from 13.8% in 2024 to 5.8% in 2025. Haryana fell from 10.7% to 5.6%. These are not marginal corrections. They represent a structural rebalancing of where demand is being generated.
Meanwhile, states that were once considered secondary markets have posted some of the largest gains. Karnataka grew from 10% to 16% in a single year. Gujarat surged from 8.7% to 13.1%. Maharashtra consolidated its position as the single largest market, growing from 16.4% to 20.1%. Tamil Nadu and Telangana both roughly doubled their shares.
State-wise market share: 2024 vs 2025
 |
Source: Cars24 Gears of Growth Report 2025
The practical implication is significant. A market once dependent on the consumption patterns of northern metros is now drawing from a far wider and more diverse base of buyers across western, southern, and central India.
Metro and non-metro buyers are not buying the same car for the same reason
What makes this shift analytically interesting is that metro and non-metro buyers are not simply buying the same cars in different locations. They represent genuinely distinct demand profiles, shaped by different economic circumstances, road conditions, income levels, and expectations of car ownership.
Share of used car sales by geography (2025)
Geography | Share (%) |
Tier-2 cities | 62% |
Metro cities | 38% |
Source: Cars24 Gears of Growth Report 2025
Metro vs Tier-2: How buyer profiles differ
Dimension | Metro cities (38%) | Tier-2 cities (62%) |
Primary buyer type | Upgraders | First-time buyers |
Top body type | SUVs and premium hatchbacks | Hatchbacks and compact sedans |
Ownership cycle | Shorter, faster replacement | Longer, value-oriented |
Key purchase driver | Aspiration and lifestyle | Affordability and reliability |
Financing adoption | Around 50% | Close to 58% |
Source: Cars24 Gears of Growth Report 2025
Metro buyers tend to treat used cars as a stepping stone to a better vehicle. They upgrade more frequently, are more willing to pay for convenience features like automatic transmissions, and lean toward SUVs and premium hatchbacks. For this segment, the used car market functions as an aspirational ladder.
Non-metro buyers approach the market differently. For many, this is their first car purchase. The decision is driven by functional need: reliable daily transportation, low maintenance costs, fuel efficiency, and strong parts availability at local service centres. Longer ownership cycles mean resale value and durability matter more than style.
According to the Cars24 Gears of Growth Report, non-metro markets also show notably higher financing adoption, close to 58%, compared to around 50% in metro cities. This reflects both the income profile of first-time buyers and the growing reach of digital lending platforms into smaller cities.
Model preferences reveal two distinct sets of priorities, not just two price points
The difference in buyer profiles translates directly into model preferences. The Cars24 Gears of Growth Report data on top-selling models by geography makes the contrast visible.
Top 10 models by geography: Metro vs Non-Metro
Rank | Metro model | Share | Non-metro model | Share |
1 | Nexon | 3.99% | Nexon | 3.95% |
2 | Baleno | 3.78% | Grand i10 | 3.65% |
3 | Grand i10 | 3.19% | Baleno | 3.13% |
4 | Tiago | 2.26% | Kwid | 2.91% |
5 | Swift | 2.17% | Elite i20 | 2.42% |
6 | Elite i20 | 2.15% | Tiago | 2.20% |
7 | Venue | 2.08% | Venue | 2.15% |
8 | City | 2.07% | Altroz | 2.14% |
9 | Baleno (higher trim) | 2.07% | Grand Nios | 1.87% |
10 | Kwid | 2.07% | Kwid | 1.84% |
Source: Cars24 Gears of Growth Report 2025
The Nexon is the top-selling model in both geographies, which speaks to its broad appeal across price points and use cases. But the divergence begins immediately after. Metros rank the Baleno second, a premium hatchback with feature-rich trims and strong automatic penetration. Non-metro markets place the Grand i10 second, a model valued for its simplicity, low running costs, and widespread service network.
The Honda City appears in the metro top 10, reflecting urban appetite for sedans despite the segment’s overall decline. It does not appear in the non-metro list at all. The Kwid, on the other hand, ranks fourth in non-metro markets, driven by its entry-level price point and low cost of ownership.
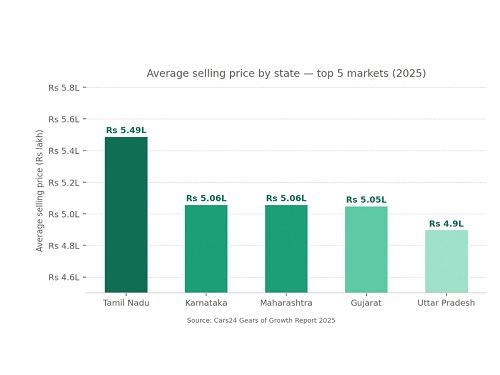
Tamil Nadu leads on spending, Uttar Pradesh reflects a value-first buyer base
Average selling prices across the top five states in the Cars24 Gears of Growth Report reveal how vehicle mix and buyer profiles translate into spending patterns.
Average selling price by state: top 5 markets (2025)
 |
Source: Cars24 Gears of Growth Report 2025. Values in Rs lakh
Tamil Nadu leads on average selling price at Rs 5.49 lakh, supported by strong mid-to-premium demand and a higher concentration of newer vehicles. Uttar Pradesh sits lowest at Rs 4.90 lakh, reflecting its value-oriented buyer base and a higher share of older, entry-level vehicles.
The Cars24 Gears of Growth Report notes that ASP variation reflects vehicle mix and age more than transaction volume alone. A state can be growing rapidly in volume while still trading at lower average prices if its buyers are primarily first-time purchasers entering at the entry end of the market.
Three forces turning smaller cities into the engine of national used car demand
Rising incomes and first-time buyers
Expanding Tier-2 cities and rising incomes among salaried and self-employed households have created a new class of first-time car buyers. For these buyers, a used car is not a compromise. It is a considered financial decision that maximises value while managing risk on an unfamiliar purchase.
Digital platforms reducing the trust gap
Historically, used car buying in smaller cities relied heavily on local dealer relationships and word of mouth. Digital platforms with certified inspections and transparent pricing have changed this, giving non-metro buyers access to the same quality assurance that metro buyers have had for longer.
SME activity and trade-driven demand
Gujarat’s sharp rise from 8.7% to 13.1% market share is not purely a consumer story. The Cars24 Gears of Growth Report points to strong SME activity, expanding trade hubs, and rising digital adoption across industrial clusters as key drivers. In many non-metro markets, vehicles serve dual purposes, moving families and moving goods, which creates a more consistently motivated demand base than pure urban consumption.
Conclusion: Tier-2 India is not catching up to metros; it is building its own market
The used car market’s geographic diversification is not a temporary phenomenon. It reflects structural changes in India’s economy: the growth of Tier-2 cities, the expansion of digital financial infrastructure into smaller markets, and the rising aspirations of a middle class that is no longer concentrated in a handful of metros.
For the industry, this means the national market is becoming more resilient. No single state or city can now determine whether it has a good year. For buyers in smaller cities, it means access to a more organised, transparent, and well-stocked market than was available even three years ago.
The Cars24 Gears of Growth Report 2025, based on data from over 33 million users, captures this transition at a meaningful scale. Tier-2 India is not catching up to the metros. It is building its own version of the used car market, on its own terms.![]()